YOUR EVERY DETAIL. AUTOMATED.


Complex reporting requirements can consume an enormous amount of time and resources.

Now repeat that several times a year or across multiple markets or categories and the costs spiral, the chances of error increase and your sanity is at threat. With report automation you can forget all the hours of manual effort, and watch your reports being generated, updated and customized at the click of a button. Reclaim time for further analysis and finding the nuggets you’ve been searching for, and even take on more profitable projects that may have otherwise been out of your reach.

Play video

E-Tabs Enterprise

Enterprise is acknowledged as the world’s most advanced and widely used report automation software.

Automate even the most detailed of PowerPoint, Word, Excel, Google Slides, Sheets or PDF reports quickly and with 100% accuracy. Enterprise can automate any ‘repetitive’ type project – whether a one-time multi-market or multi-category study, continuous tracker, KPI scorecard, concept-test or ad-test, with even the most demanding of requirements.

Built specifically with market research needs in mind, Enterprise will automatically pull in the data from your existing data analysis and tabulation systems and put it into your template and choice of charts. Enterprise can perform statistical significance testing, sort & re-rank, calculate nets, averages and trends. Enterprise can also conditionally format the output with indicators, brand logos and images positioned automatically where needed, reformat text, highlight key values and much, much more. Reports that may have taken days or weeks to produce can now be updated effortlessly within minutes. Faster turnaround, increased profitability, reassuring quality, greater insight – it’s a no-brainer!
Why Enterprise?

Enterprise can read in any industry-standard tabulation files; Excel, SPSS, Sheets, Dimensions, Quantum, Wincross, Uncle, Mentor, Q, and more! Enterprise inherently understands the unique layouts of banner tabulations, with cross-breaks, frequencies, percentages, significance testing, base rows, sub-nets, statistics, etc. So there’s no need to run special DP outputs to facilitate the automated charting.

For any given project, Enterprise can pull data from an unlimited number of source files at the same time, and even combine those values into the same chart. Sometimes you may have data in tables coming from one file, and benchmark values or norm scores coming from another. Sometimes you have data for multiple markets or multiple waves coming from separate files or worksheets.  

Enterprise just takes everything in its stride. Enterprise isn’t tied to fixed locations of data, it can also locate based on text/variables and ranges; if for example you’re looking for a brand name whose position may fluctuate from wave to wave or between markets, we’ll find it!  Different brand names or number of brands between files? Go for it!

The Enterprise approach enables any existing PowerPoint deck, Excel workbook, Google Slides, Sheets or Word report to be used as a template for subsequent automation. Hence design your project in precisely the same way as you’re used to, and then simply set it up for pulling in the data from your source files. This means you can take an ongoing project and hit the ground running without having to sacrifice any layout, structure, formatting and charting preferences. Once populated, all charts and objects remain editable as native PPTX, XLSX, GSLIDES or DOCX files. If you need to deliver the final reports as PDF, you can choose that as your final output too. 

No nets or stats in your original tables? Not a problem, Enterprise can calculate them all dynamically as needed. Comparing trends, sums, averages, stats – choose from the built-in library of standard statistic tests or use your own formulae. 

Enterprise can adjust the formatting of your reports based on the fluctuations within your data on each and every output. For example, automatically colour charts based on branding or data value. Automatically position brand logos, flags, indicators or other icons and images onto a chart or within a table. Automatically change text based on values; essentially inserting standard analysis text using AI. Automatically remove data columns or rows or entire objects if deemed irrelevant based on values such as low bases.

Enterprise can generate multiple sub-reports from a single template and handle variance between them. The result will be a set of reports that will look customized without all the manual effort.


REPORTING SERVICE

Automate Using Enterprise Yourself, or We Can Do It For You

Of course you can take a license and use Enterprise yourself, or alternatively consider using the E-Tabs Bureau Reporting service. This is the ‘hands free’ approach to report automation where we do the work for you. Save time, money and resource by utilising our award winning local outsourcing team. Since 2004 our team have worked on thousands of MR projects - no project is too big or complex, nor too small! Our experience means we understand your unique needs and will deliver accurately populated reports, on time and within budget. Contact us for a quote on your project now!


CLOUD-BASED AUTOMATION

Do you feel limited by the export and charting options offered by your current online platforms?

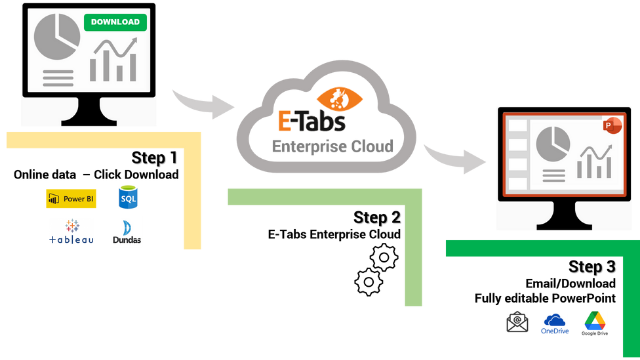
Enterprise Cloud – our cloud based report and chart automation platform can accept data from ANYWHERE – and then populate your own native PowerPoint or Google Slides “template” deck including fully editable charts and tables.

Online dashboards, CRM systems and more – including PowerBI and Tableau – can connect directly with Enterprise Cloud to generate fully customized, editable chart decks on-demand.  These decks are populated with whatever filtered or selected data the user has chosen within their online platform, and Enterprise Cloud then sends the user their final report via email attachment or a link to download.


Contact Us

We have offices in three strategic
locations around the globe.

Europe

London (HQ)
+44 (0) 20 8205 4665

Unit 2, Technology Park
Colindeep Lane
London
NW9 6BX, UK

North America

Chicago
+1 888 823 8227

Asia Pacific

Auckland

Got a question or comment?

Would you like to know more about any of our products and services?
Then fill out the form below and we’ll be in touch promptly.