 Upcoming Webinar With Kantar South Africa
CLICK HERE TO Secure Your Spot Now! DATE: February 6, 2024Time: 3pm GMT Reporting is often one of the most time and labor intensive parts of market research, particularly for multi-country and frequent-cadence tracking studies. In today’s fast-paced world, efficiency is key… By leveraging report automation the correct way, your report production time can be […]
 Google Slides Webinar
CLICK HERE TO Secure Your Spot Now! Facing client pressure to deliver reports in Google Slides or Sheets? Over the last couple of years there’s growing demand and standardisation for Google-based deliverables in the market research industry. Compared however with PowerPoint, reporting in Google Slides is not as user-friendly and described by users as “stressful, […]
 A Year In Review! 2023 Round Up
2023 at E-Tabs As we close the chapter on another incredible year, we reflect on our team’s hard work and accomplishments! We’ve achieved remarkable milestones – expanding our team, launching our new product SlideCraft, attended 10 conferences, and having the opportunity to work closely with our amazing clients to automate high quality reports in no […]
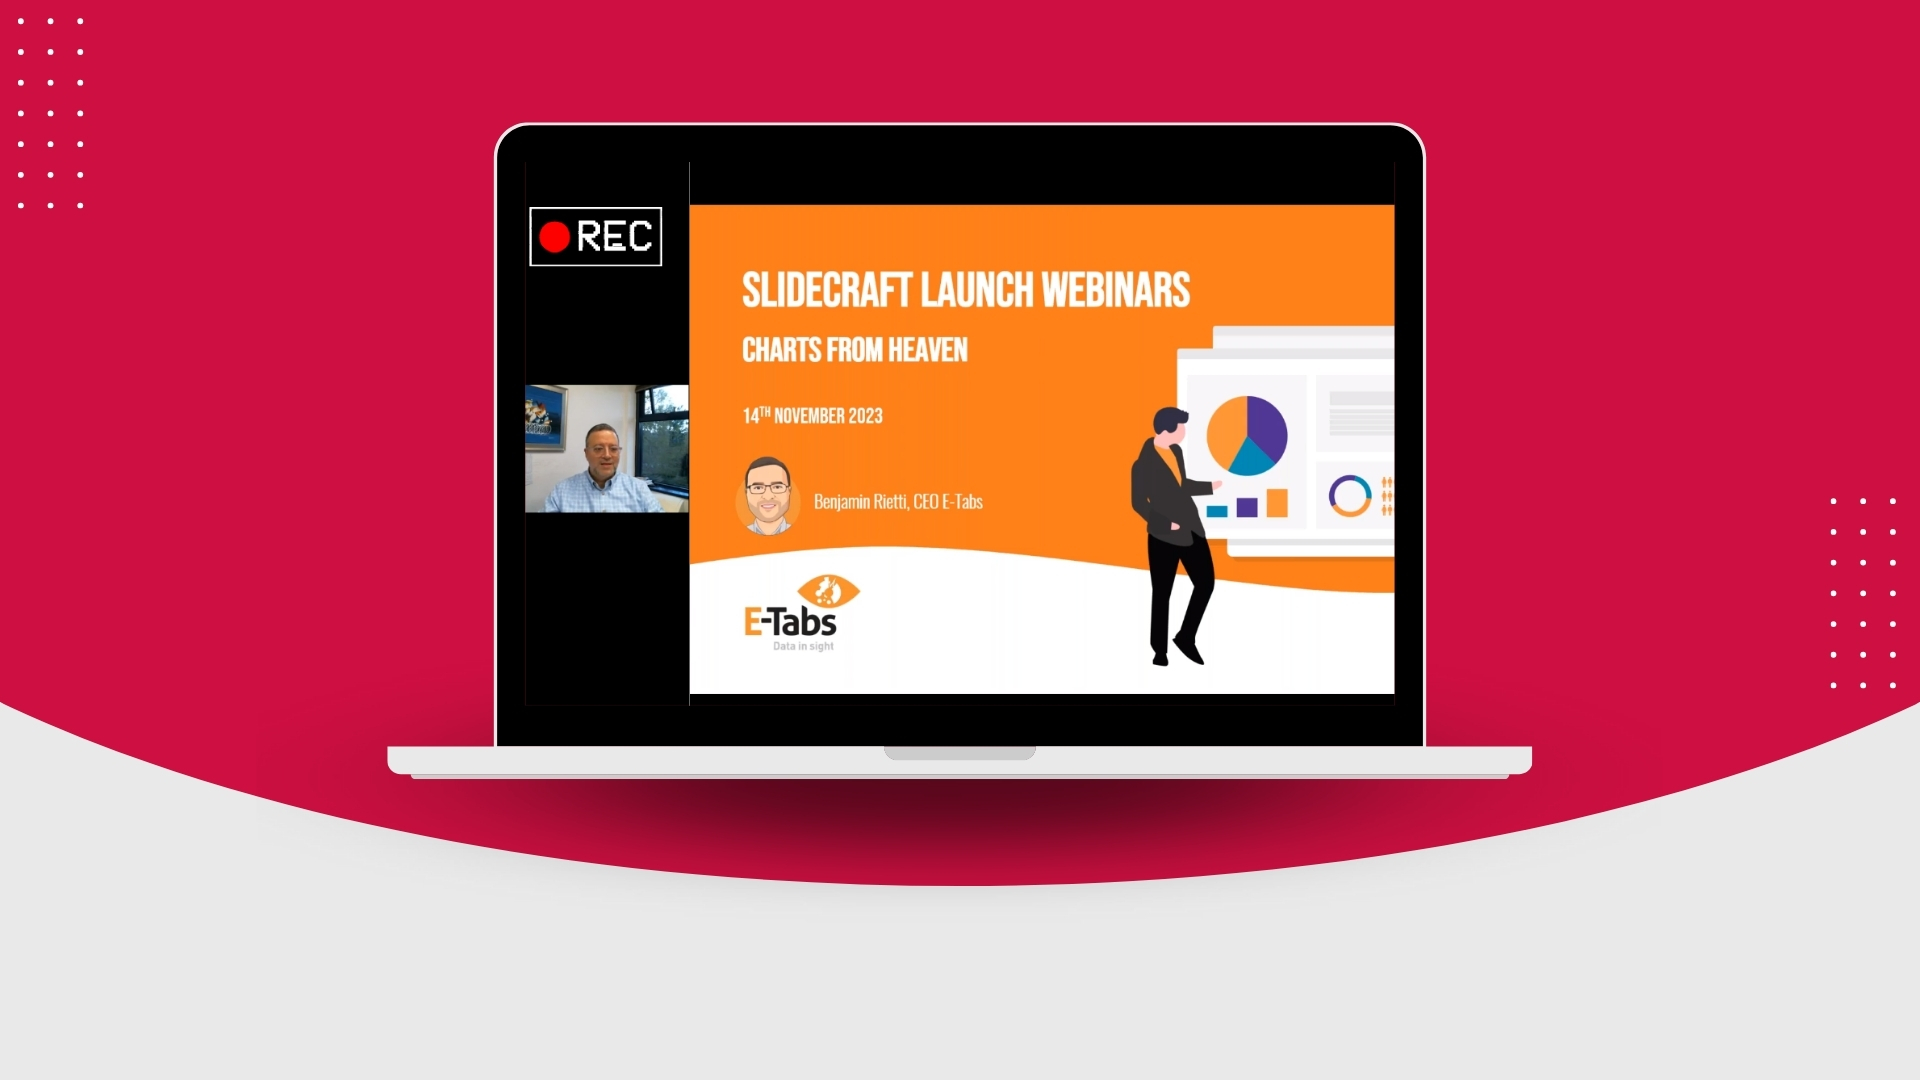 SlideCraft Product Launch Webinar Recording
SLIDECRAFT LAUNCH WEBINAR We had an amazing product launch for our new cloud-based tool SlideCraft. Over the last two weeks CEO Benjamin Rietti has given webinars to audiences around the world where he shows the amazing capabilities of the best bulk PowerPoint charting tool on the market. Watch the webinar below! SlideCraft – ‘The Pick […]
 Webinar In Conjunction With Ipsos and CRIC!
We’re delighted to invite you to our upcoming webinar in conjunction with CRIC and Ipsos: Euphoria! How advances in ResTech leverage report automation for faster, more efficient, and more accurate reporting on Quant projects LAST CHANCE TO REGISTER! Click HERE to secure your free spot now. Date: Tuesday 17th October 2023 Time:12pmEST Join Vice President […]
 Webinar – Cutting Edge Automated Charting
Cutting Edge Automated Charting Missed our automated charting webinar? You can view the recording below! Key Takeaways included: – The difference between an automatically generated chart and a fully loaded deliverable.– How automated reporting can be used on many project types, including ad-hoc and multiple outputs including Google.– Leveraging automated charting to include fully editable […]
 Bring Your Reporting To Life With Instant PowerPoint Infographics
Bring Your Reporting To Life With Instant PowerPoint Infographics Ensuring that your research data is more visually engaging and easily grasped is more important than ever. Data Visualizations such as proportional infographics, gauges, maps, wordclouds and more, allow you to express the data in a way that’s often easier to comprehend than just typical PowerPoint […]
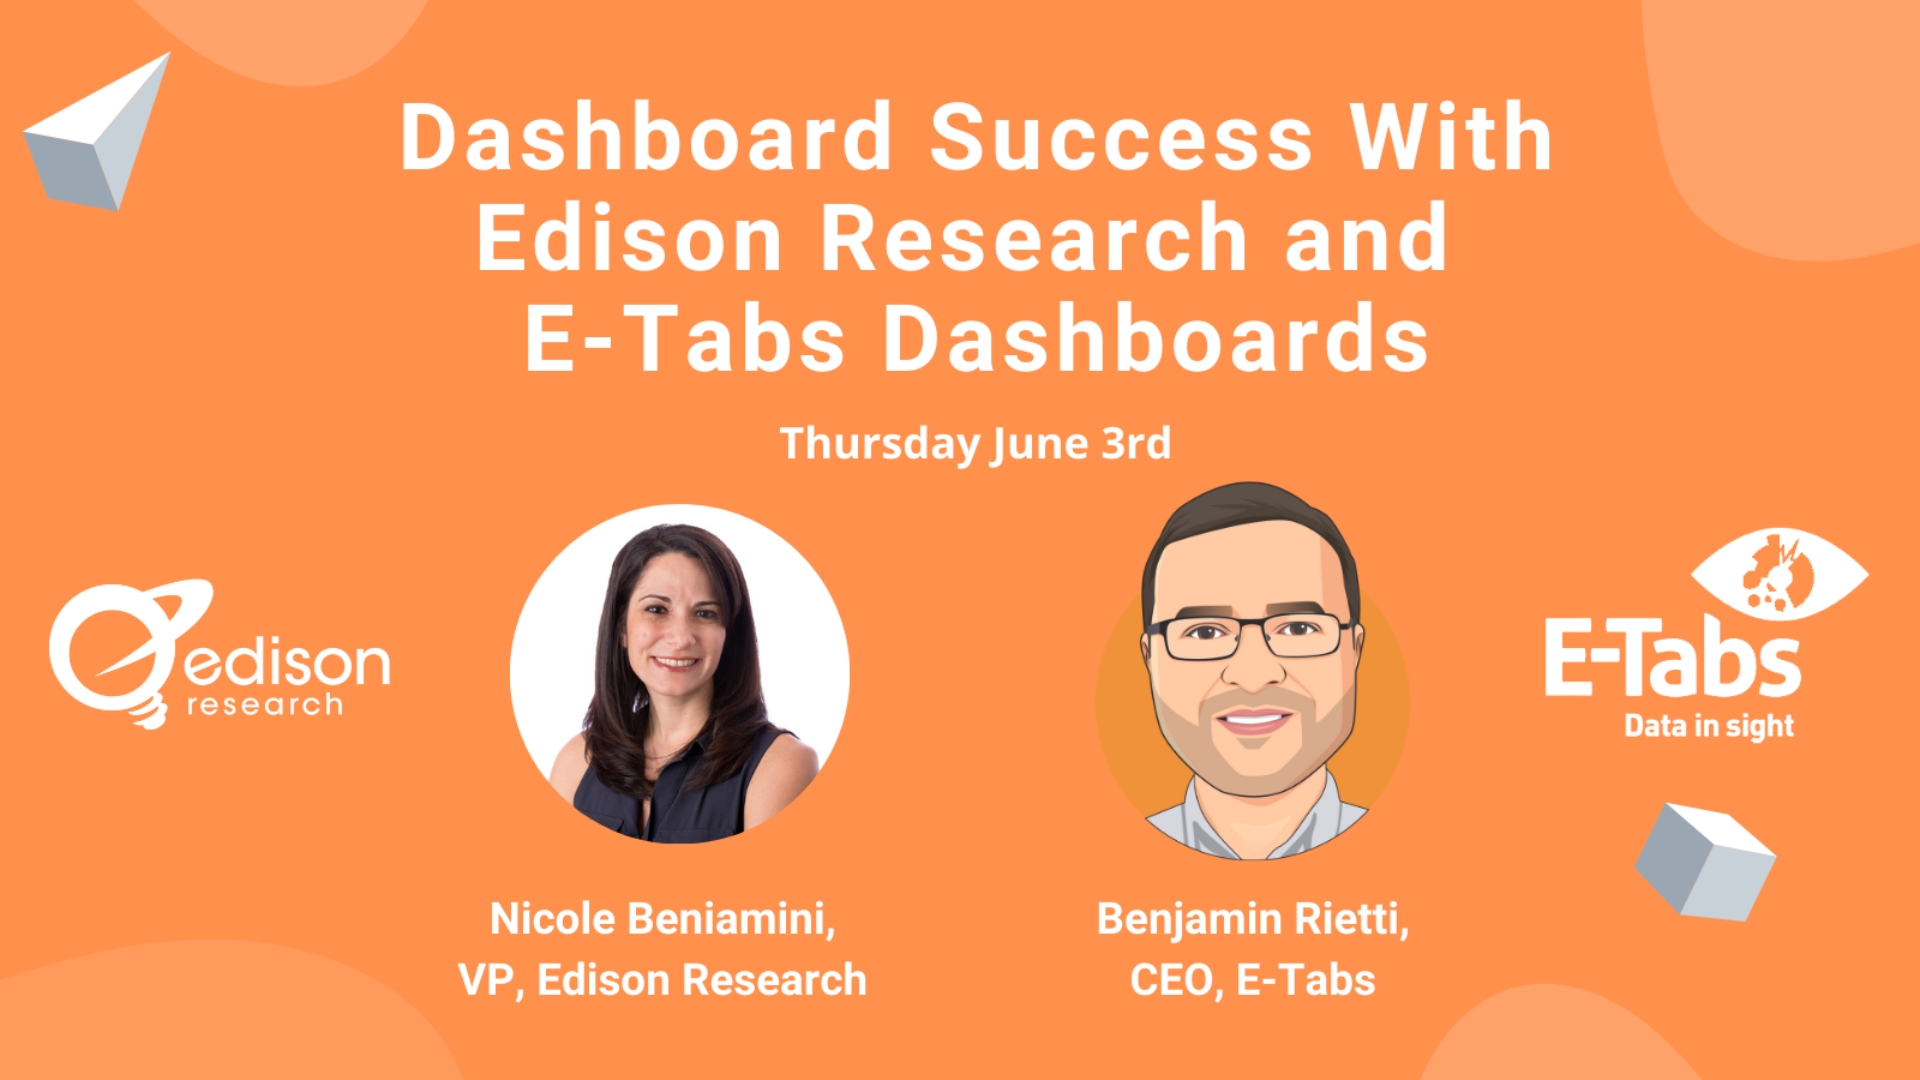 Webinar – Dashboard Success With Edison Research!
Dashboard Success With Edison Research There is an increasing demand for visually appealing, interactive access to survey results in market research. Online dashboards can provide a great reporting solution, but what truly makes for a successful dashboard? In this webinar hosted by E-Tabs, Benjamin Rietti and guest presenter Nicole Beniamini from Edison Research, outline the […]
 Taking Automated Charting and Reporting To The Next Level
Taking Automated Charting and Reporting To The Next Level Join our upcoming Automation webinar presented by Benjamin Rietti! Find out how you can be more efficient with your charting and reporting. Taking place on Wednesday May 12th at the following times: London 4:30 BST New York 11:30 EDT Session Description Budgets tightened and profit margins […]
 E-Tabs and ESOMAR Webinar!
E-Tabs and ESOMAR Webinar Join our ESOMAR webinar on Tuesday 2nd March, and learn how to maximise efficiency with automation! Abstract – Many research teams and companies are facing tighter budgets and resourcing issues. It is imperative to be efficient now more than ever. Finding efficiencies in the report building process not only gives you […]