 Chart Chats: Inside the World of Data’s Greatest Storytellers!
Welcome to “Chart Chats”, the ultimate gathering of data’s finest emissaries! In this series, we’ll get to the heart of different chart styles to better understand how they tick, through intimate and humorous interviews with the charts themselves. Today, we’re bringing you the bar, the pie, and the line. Strap in for a rollercoaster ride […]
 Breaking Down Barriers: Overcoming Challenges in Traditional Charting Processes
Overcoming the challenges of Traditional Charting As organisations look to increase efficiencies and streamline workflows, traditional charting processes are often both the cornerstone and the stumbling block. While charts are intended to visually represent data and relationships, the methodologies used to create them have become stuck in outdated practices which hinder rather than facilitate progress. […]
 Webinar: Turbocharge Your PowerPoint Charting
Ad-Hoc Project Reporting at Lightning Speed! Register HERE Date: Thursday 11th July 2024 I Time: 11AM ET, 4PM BST Presenter: Benjamin Rietti, CEO, E-Tabs For many years, PowerPoint users have been manually posting data into custom PowerPoint chart decks. This method is extremely inefficient and eats into valuable time which would be better spent […]
 ICG & E-Tabs Webinar: Charts From Heaven
E-Tabs SlideCraft Webinar: Register here! Date: 17 April, 2024 I Time: 3:00-3:30pm GMT Speaker: Benjamin Rietti, CEO, E-Tabs In conjunction with ICG, join us on April 17th to find out how you can generate fully populated, editable PowerPoint decks in a matter of seconds, with our latest PowerPoint charting tool SlideCraft… SlideCraft […]
 SlideCraft Product Launch Webinar Recording
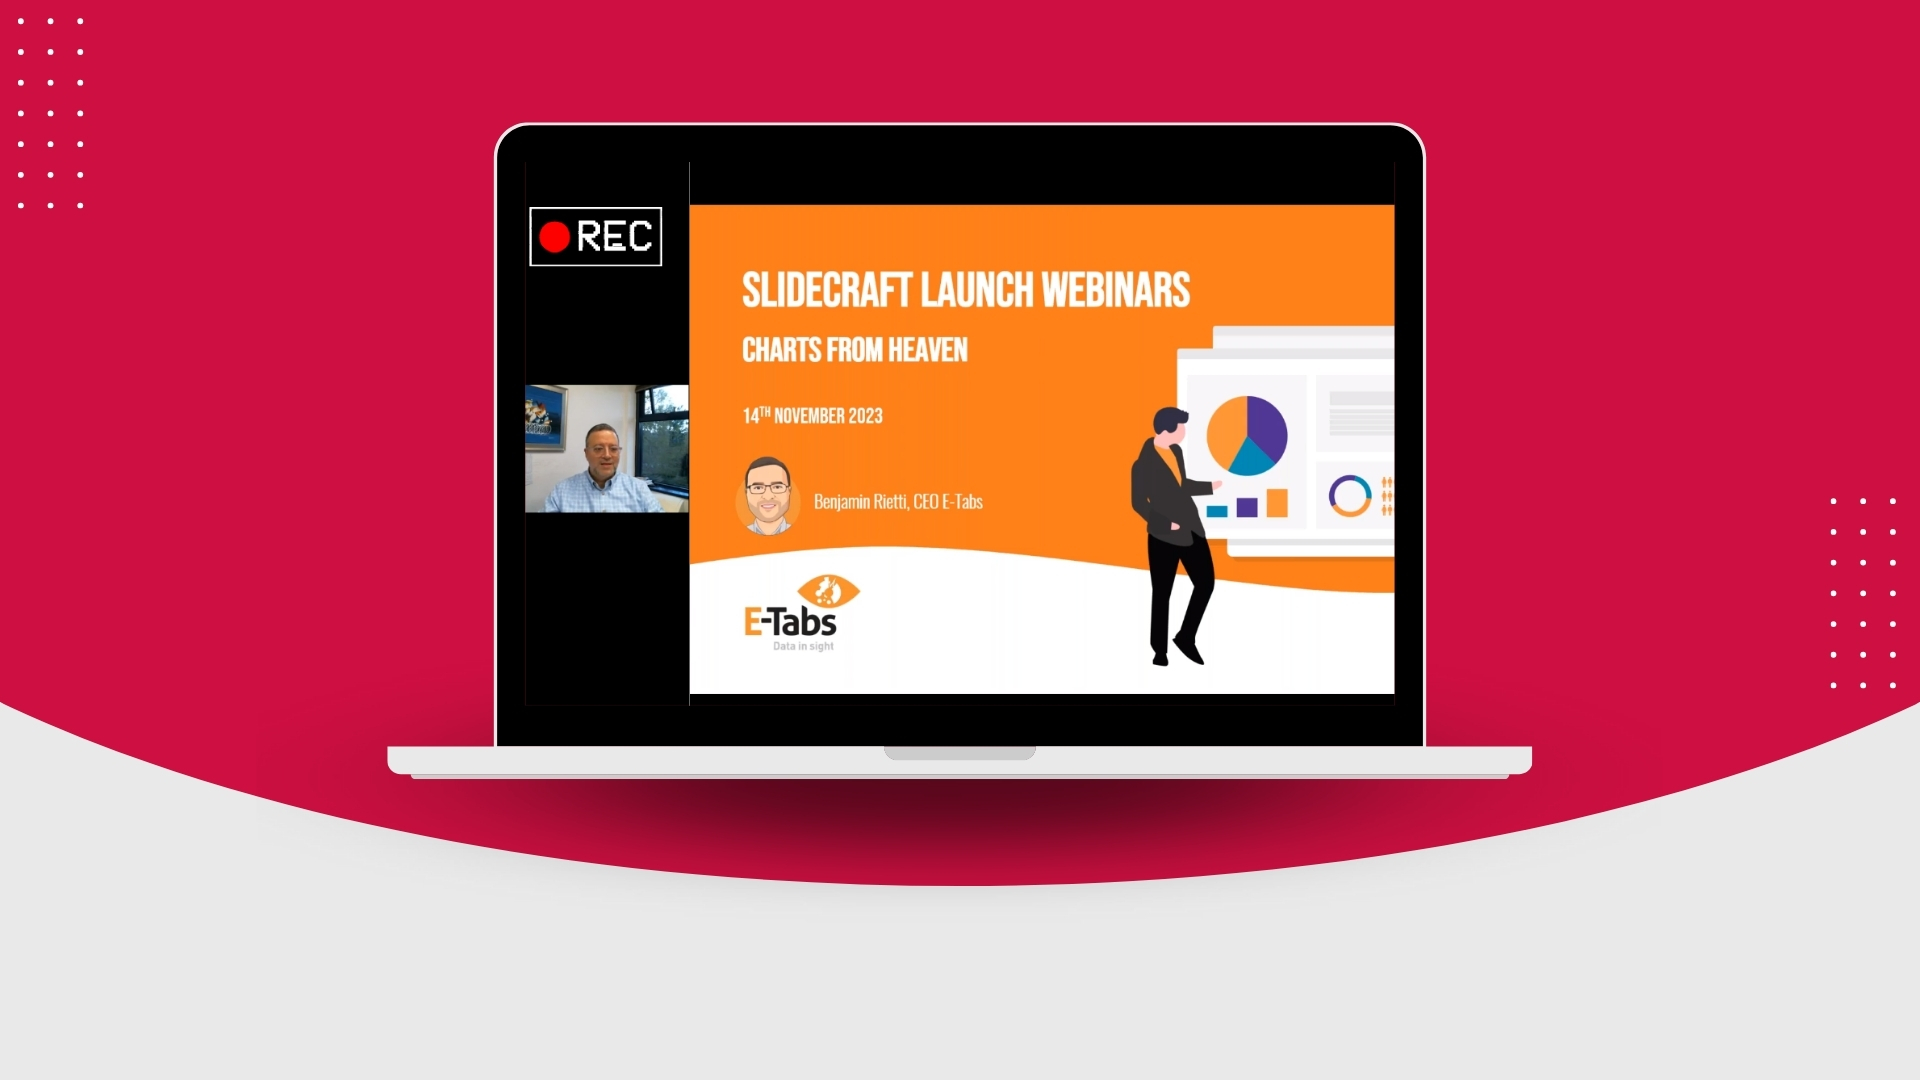
SLIDECRAFT LAUNCH WEBINAR We had an amazing product launch for our new cloud-based tool SlideCraft. Over the last two weeks CEO Benjamin Rietti has given webinars to audiences around the world where he shows the amazing capabilities of the best bulk PowerPoint charting tool on the market. Watch the webinar below! SlideCraft – ‘The Pick […]
 The Power of PowerPoint
PowerPoint: The Leading Presentation Tool! Since its release in 1990, Microsoft PowerPoint has been the world’s most ubiquitous presentation tool. Probably the easiest-to-use presentation graphics software, PowerPoint is a fool-proof package which hands you everything you need to create a presentation that always looks put-together enough to make you feel like a professional. Word processing, […]
 How to Make PowerPoint Charting Easier Using Graphique
Like most market researchers, you’ve likely had the same experience at one point in your career – trying to manually create a chart using PowerPoint. This often involves either using good old-fashioned and reliable (or unreliable, depending on how you see it) copying and pasting from Excel into the presentation file, or hand-posting the numbers, […]
 Case Study: The Olinger Group
Who are The Olinger Group? For the past 27 years, The Olinger Group has been a national leader in marketing research for the world’s top companies and brands. With profound expertise in both quantitative and qualitative research studies, The Olinger Group specializes in custom, primary research designed specifically for each client’s unique set of needs. […]
 Case Study: Moore Information Accelerates Report Delivery
Who is Moore Information? Moore Information is a public opinion research and strategic advice firm, founded in 1981. They have earned a national reputation for excellence in quantitative and qualitative research in politics, public affairs, relations & policy, and government relations. Their research has been instrumental in helping clients win elections, affect public policy, shape corporate […]
 Relief from the Reporting Silly Season
It’s Reporting Season! With the end of the year rapidly approaching, the rush to get projects completed and sent to clients by year-end is here. The extra pressure in this period does bring with it resourcing challenges and can lead companies to consider outsourcing certain aspects of the market research process – with reporting being […]