 Case Study: The Olinger Group
Who are The Olinger Group? For the past 27 years, The Olinger Group has been a national leader in marketing research for the world’s top companies and brands. With profound expertise in both quantitative and qualitative research studies, The Olinger Group specializes in custom, primary research designed specifically for each client’s unique set of needs. […]
 A first for the integration of automating market research data & Google Slides
An Industry First – Fully Automated Charting & Reporting in Google Slides! Hailed as a first for the integration of automating market research data and Google Slides, reporting solutions provider, E-Tabs have announced the launch of Google-charting integration within their report automation platform, E-Tabs Enterprise. Until this point, many research providers were limited to providing […]
 Webinar – Cutting Edge Automated Charting
Cutting Edge Automated Charting Missed our automated charting webinar? You can view the recording below! Key Takeaways included: – The difference between an automatically generated chart and a fully loaded deliverable.– How automated reporting can be used on many project types, including ad-hoc and multiple outputs including Google.– Leveraging automated charting to include fully editable […]
 Enterprise & Google Slides
Enterprise & Google Slides Over the past few months, the E-Tabs development team has been working on integrating our report automation software, Enterprise, with the Google Suite. This new development will enhance E-Tabs Enterprise’s leading platform for the automation of Market Research reporting in Microsoft Office. This decision to integrate Enterprise with the Google Suite […]
 Bring Your Reporting To Life With Instant PowerPoint Infographics
Bring Your Reporting To Life With Instant PowerPoint Infographics Ensuring that your research data is more visually engaging and easily grasped is more important than ever. Data Visualizations such as proportional infographics, gauges, maps, wordclouds and more, allow you to express the data in a way that’s often easier to comprehend than just typical PowerPoint […]
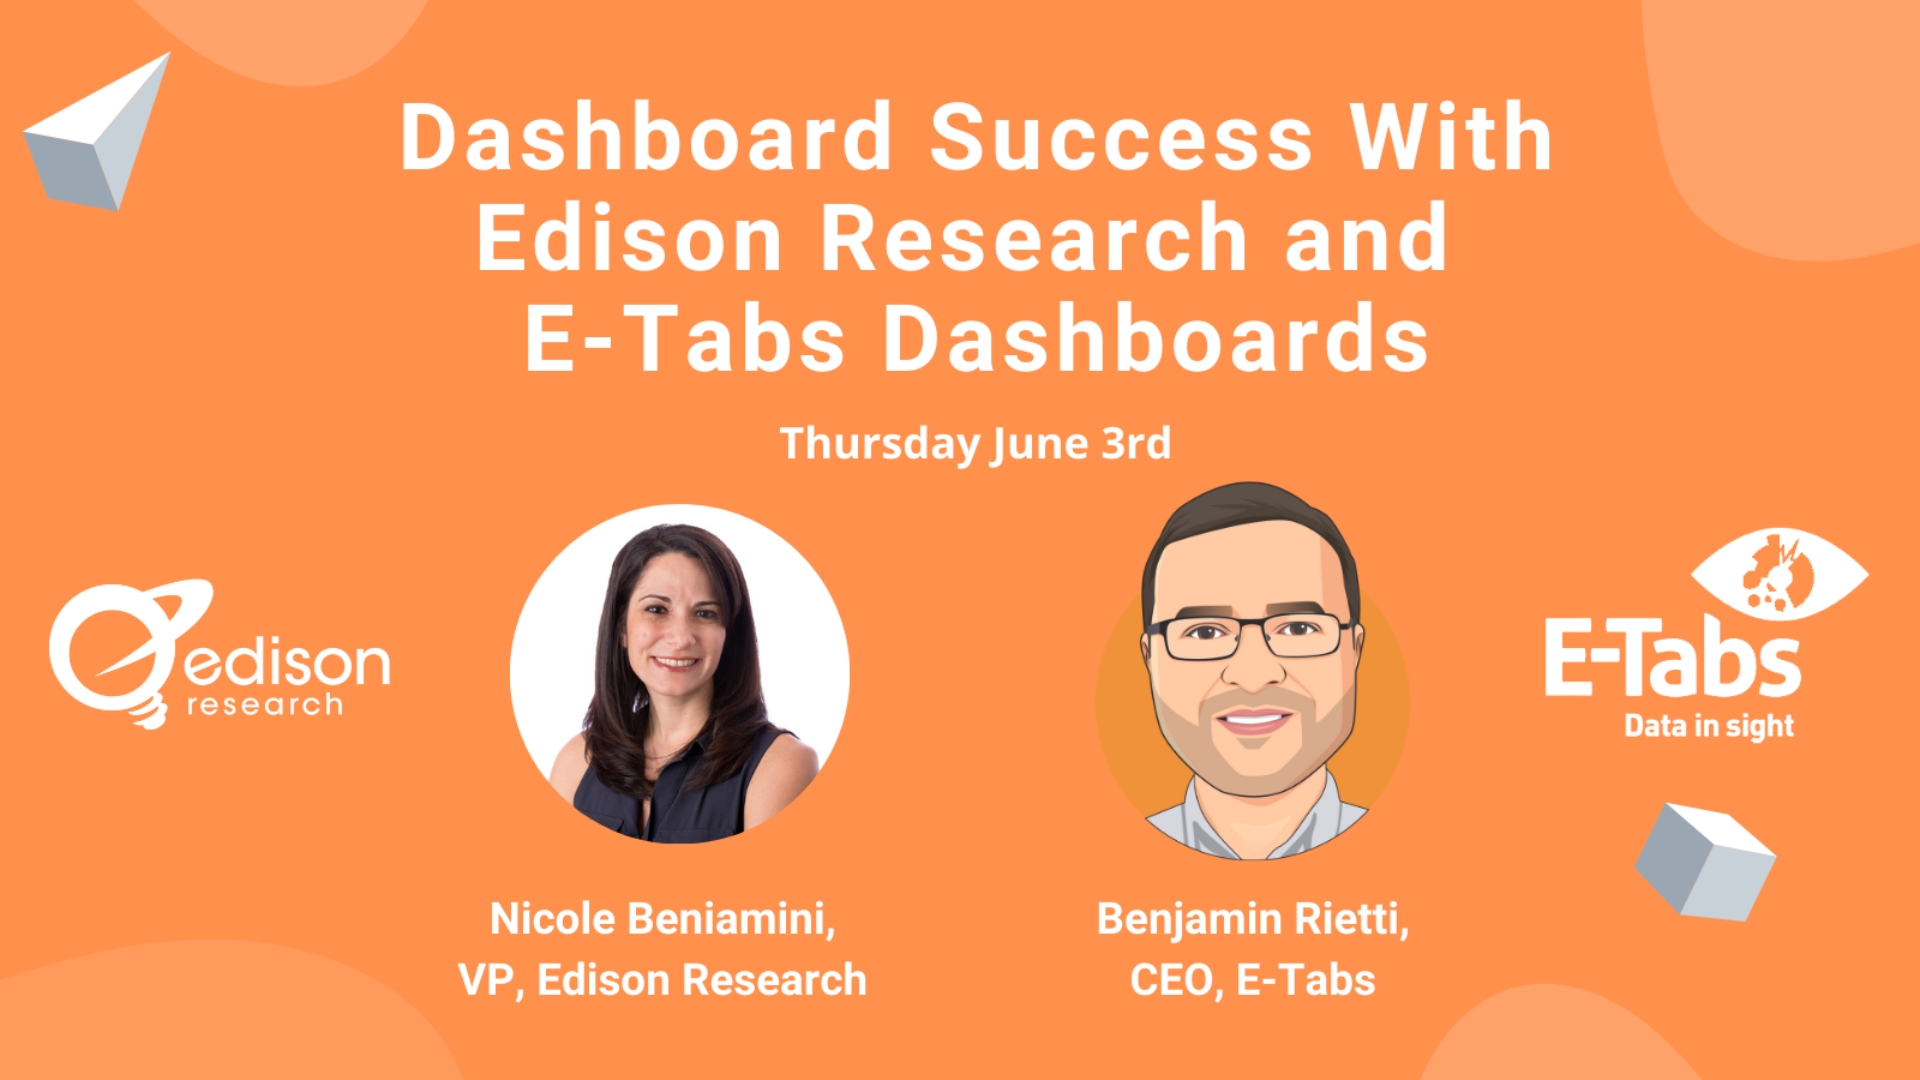 Webinar – Dashboard Success With Edison Research!
Dashboard Success With Edison Research There is an increasing demand for visually appealing, interactive access to survey results in market research. Online dashboards can provide a great reporting solution, but what truly makes for a successful dashboard? In this webinar hosted by E-Tabs, Benjamin Rietti and guest presenter Nicole Beniamini from Edison Research, outline the […]
 Taking Automated Charting and Reporting To The Next Level
Taking Automated Charting and Reporting To The Next Level Join our upcoming Automation webinar presented by Benjamin Rietti! Find out how you can be more efficient with your charting and reporting. Taking place on Wednesday May 12th at the following times: London 4:30 BST New York 11:30 EDT Session Description Budgets tightened and profit margins […]
 WIN World Survey Dashboard, Presented By E-Tabs
WIN World Survey Dashboard, Presented by E-Tabs E-Tabs are once again delighted to collaborate with WIN to report the annual WIN survey. WIN, the Worldwide Independent Network of Market Research and Opinion Poll, is a global network conducting market research and opinion polls in every continent, and the WIN World Survey (WWS) is the international survey carried […]
 Succeet 21 Presentation Recording
Succeet 21 Presentation Recording Didn’t attend the Succeet Virtual Event? Watch Benjamin Rietti present on how to be more efficient with your reporting! Presentation description – Webinar Description – Many research teams and companies are facing tighter budgets and resourcing issues. It is imperative to be efficient now more than ever. Finding efficiencies in the […]
 Automation can handle variations!
Automation can handle variations, by Jon Hackenbroch When working with multiple output projects, one of the key points to clarify before starting any automation is to check for any variation between reports or slides. While you may feel a questionnaire is identical between markets, there can be a number of things that will create a […]