

In this article, we will explore Illuminas’ approach to successfully implement automation into their reporting processes.
Illuminas are a full-service, research consultancy dedicated to delivering strategic marketing intelligence across B2B and consumer markets. Their focus is on helping each client address key business issues and inform critical business decisions by providing custom quantitative and qualitative research solutions.
AUTOMATION & RESISTANCE TO CHANGE
Organisations are constantly seeking for ways to make their operations more efficient. The goal is to constantly grow to become more productive, more cost effective, and more profitable. Automation, if implemented correctly, can streamline, and centralise manual tasks such as distributing onboarding materials to new hires, sending invoices to clients, and creating reports.
Many departments have designed fixed working processes for their projects, so if they look to insert a new automation tool, their intention is to simplify parts of their existing processes. Problems arise if the tool does not integrate with existing software or prove to be too difficult for employees to adopt. When companies become too rigid with their approach to any workflow, it becomes very difficult for both directors and employees to shift their mindset.
THE SEARCH FOR REPORT AUTOMATION
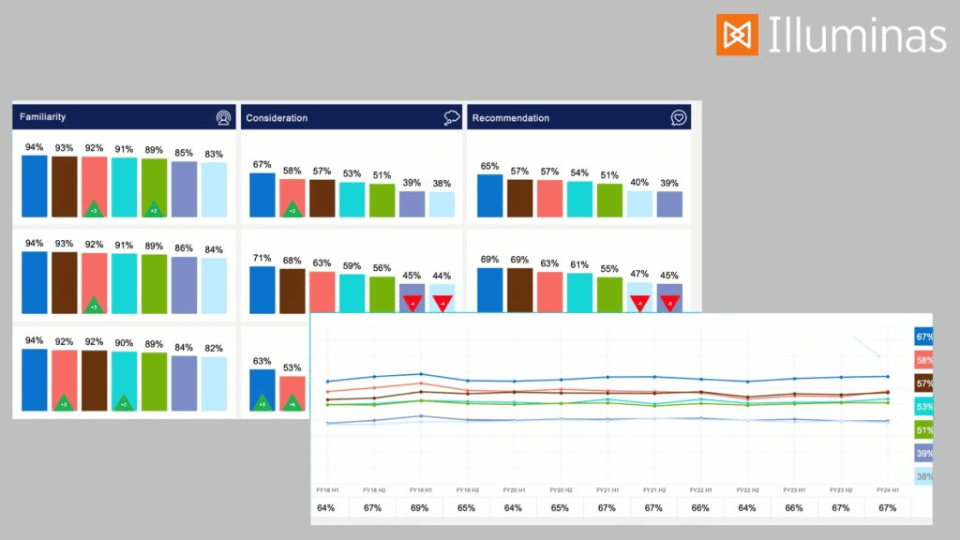
Monika Rogers, VP Growth, Insights and Transformation, explained that her team’s goal was “to bring AI and automation into their workflows. We had a particular focus related to reporting itself not only how to show results to clients in terms of PowerPoints but everything else including quantitative and qualitative data, how you extract data, visualise data, and bring data to life.”
“WE WANT TO GET RID OF THE THINGS THAT ARE REALLY BORING AND BURDENSOME SO THAT PEOPLE CAN SPEND TIME ON MORE VALUE-ADDED TASKS.”
Monika Rogers,
VP Growth, Insights and Transformation, Illuminas
One of the challenges Monika faced when implementing report automation was that Illuminas had a defined linear process for building their reports. The process had specific guardrails in place to make sure they would not make errors and thereby limit rework – tedious to say the least. It was difficult to implement changes to this rigid workflow.
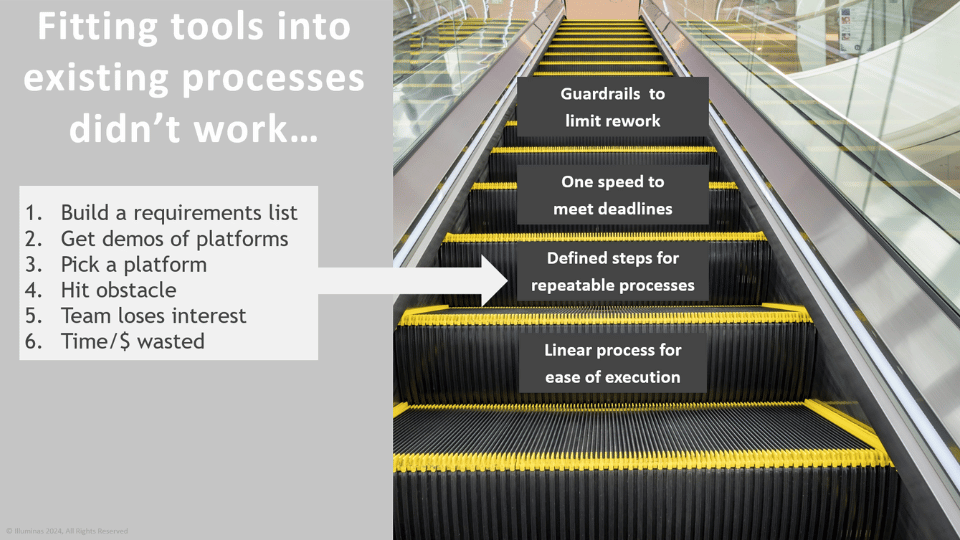
Monika and her team searched for suitable automation tools that could potentially meet their requirements, scheduled demos, and picked a solution. They immediately hit an obstacle. Illuminas was trying to fit the solution into their existing reporting workflow. It was hard for employees to learn the new tool and, more importantly, the new tool did not integrate with their existing applications. “We basically stopped using the tool, and it really felt like our time and energy was wasted. We really wanted to break the cycle of trying tools and then these tools fall off in the organisation.”
THE APPROACH TO SUCCESSFULLY IMPLEMENT AUTOMATION
Monika revisited and reinvented Illuminas’ approach to implementing automation tools. Rather than conforming all the tools to a strict set of requirements from day one, Monika suggested that they should “break it down into smaller pieces.” Her team segmented their reporting needs and considered multiple solutions, “Let’s think about what are the easiest slides to automate?” “What are the most common reports we do?”
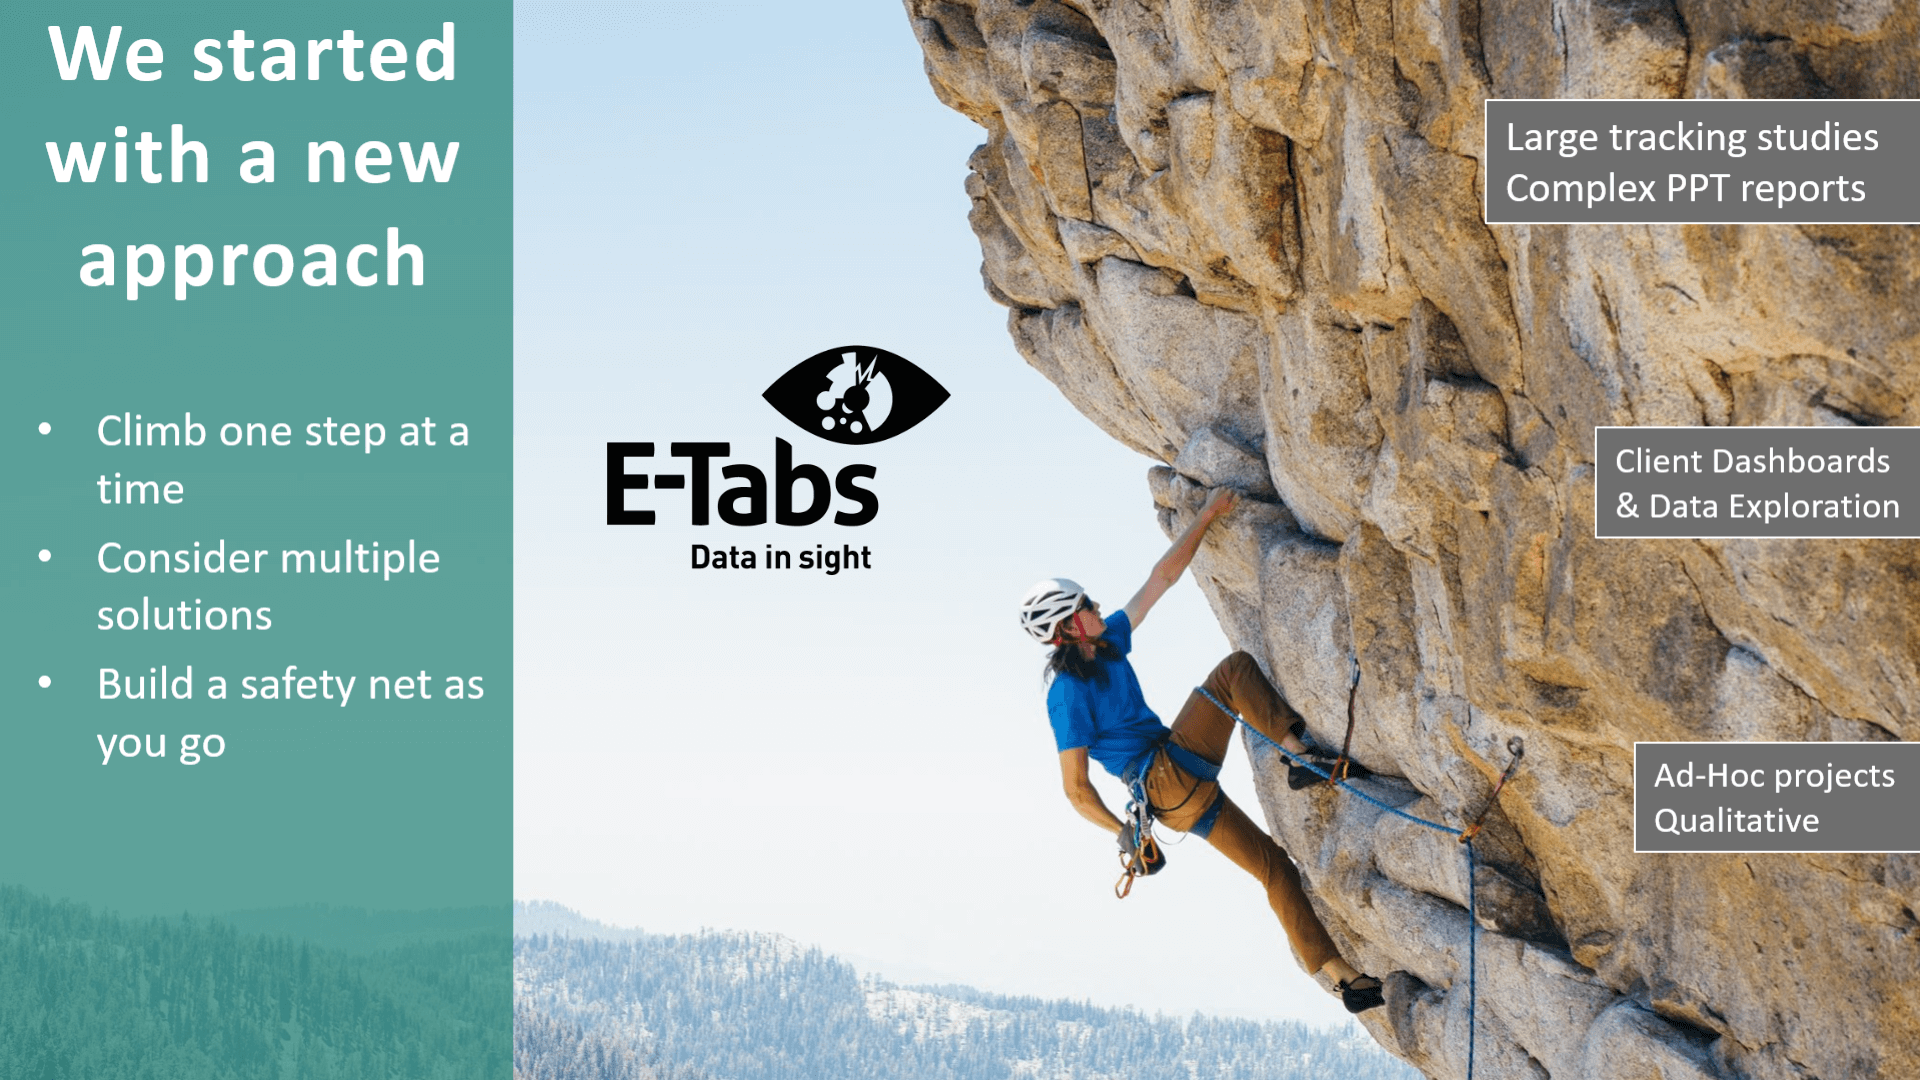
They found success through first implementing automation tools for Ad-Hoc and qualitative projects. These solutions automated Open-End analysis, charts, data entry, and coding. She achieved further success in client dashboarding through making the dashboard available to clients.
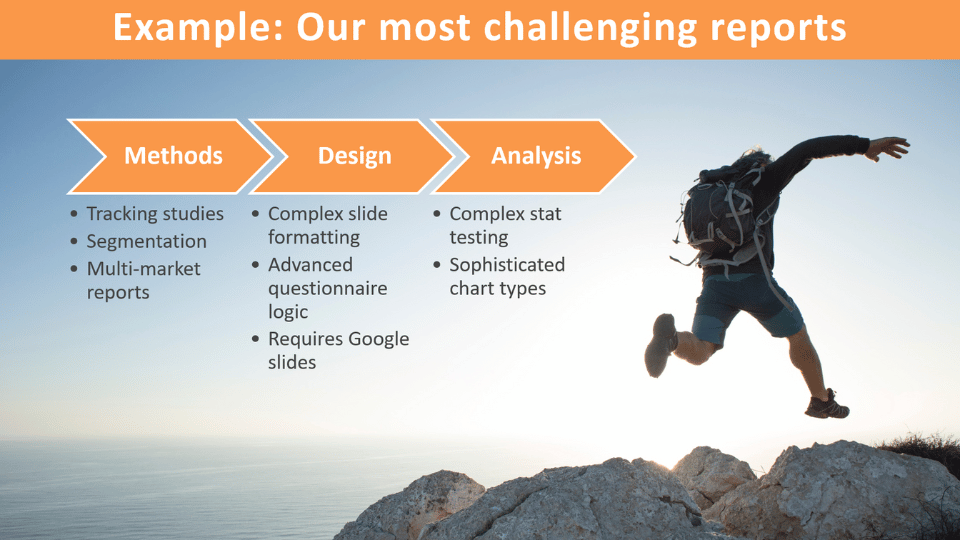
However, after this process and after reviewing their reporting needs, Monika discovered “There were still a bunch of study types that weren’t automated.” This “final bucket” included “large studies that produced complex PowerPoint reports such as tracking studies, segmentation studies and multi-market reports that produced thousands of slides across reports.” They struggled to find an automated solution that could handle “Conditional chart formatting, complex stat testing and questionnaire logic, and a Google Slides integration.”
Monika sought to find an automated solution for this “final bucket” through exploring report automation tools in the market and experimenting with them in their workflow.
HOW TO EVALUATE AUTOMATED SOLUTIONS
Illuminas evaluated three solution models:
1) Build your own solution – This option is best when you have a consistent need for automation and you want total control over the automation solution. However, this comes with a large upfront cost and will likely need to have constant updates from in-house engineers for new needs that may arise.
2) Subscription solution – This option is best when you have a consistent need for automation but your current tools are not sustainable for taking on multiple projects and there are better solutions in the marketplace. This solution also gives users time/cost savings but it may be a learning curve for employees adopt a new tool.
3) Contract Solution – This solution is suitable for less frequent projects or if current staff do not have the skills to implement the report automation solution. This option gives the user the least control of of the three options but the complexity of the project may require the expertise of a consultant who can advise on strategy and enact the automation.
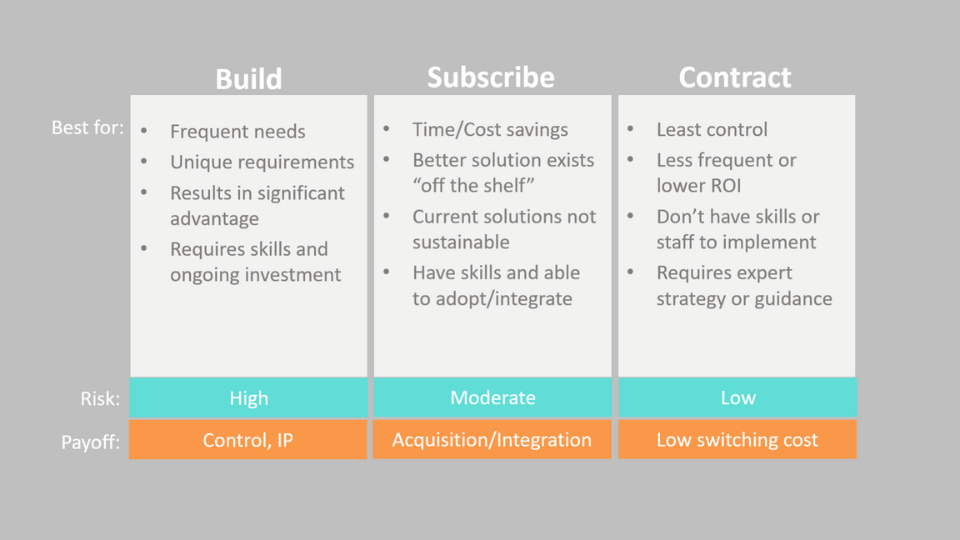
After weighing up these three options, Illuminas concluded that building their own solution was the riskiest route to go down. They explored both subscription and contract solutions in the marketplace.
PROOF OF CONCEPT
Illuminas experimented with multiple vendors to see which solution would yield the best results for the “final bucket”. Illuminas asked each vendor to build a proof of concept that could be replicated. This required each vendor to set up an automated charting solution using Illuminas’ PowerPoint templates and data tables. Illuminas then trialed the solutions themselves using real data for a real client deliverable. Illuminas judged the vendors on ease of use, time savings, stat-testing functionality and more.
CHOOSING E-TABS
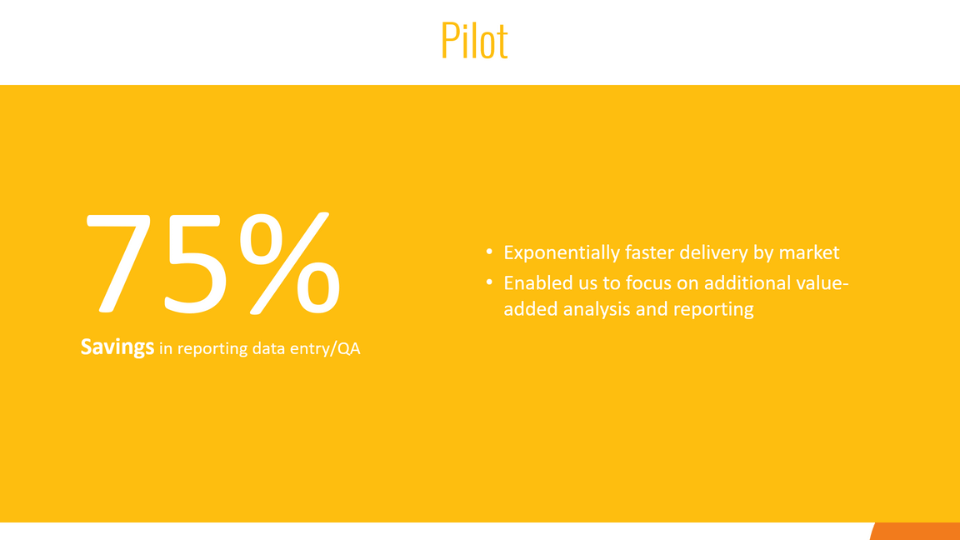
After reviewing the results, Monika recalled that “it was interesting because one vendor got us around 85%-90% there, but E-Tabs got us 100% of the way there.” Monika shared that it was this “proof of concept” that made them conclude that E-Tabs was the solution to adopt, “We discovered a 5%-10% gap and how big of a difference it could make.” On E-Tabs’ pilot study Illuminas saw a “75% savings in just data entry and quality assurance alone. This has created an exponentially faster experience for our clients. Clients say ‘This is great, we’re getting this really quickly, we love the quality of it.’ I think the ability for us to respond quickly, answer more questions, and answer more complex questions was really of value to our customers.”
E-Tabs offer both subscription, E-Tabs Enterprise, and contract E-Tabs Reporting Bureau Service automated solutions.
“ONE VENDOR GOT US AROUND 85-90% OF THE WAY THERE, BUT E-TABS GOT US 100% OF THE WAY THERE!”
Monika Rogers,
VP Growth, Insights and Transformation, Illuminas
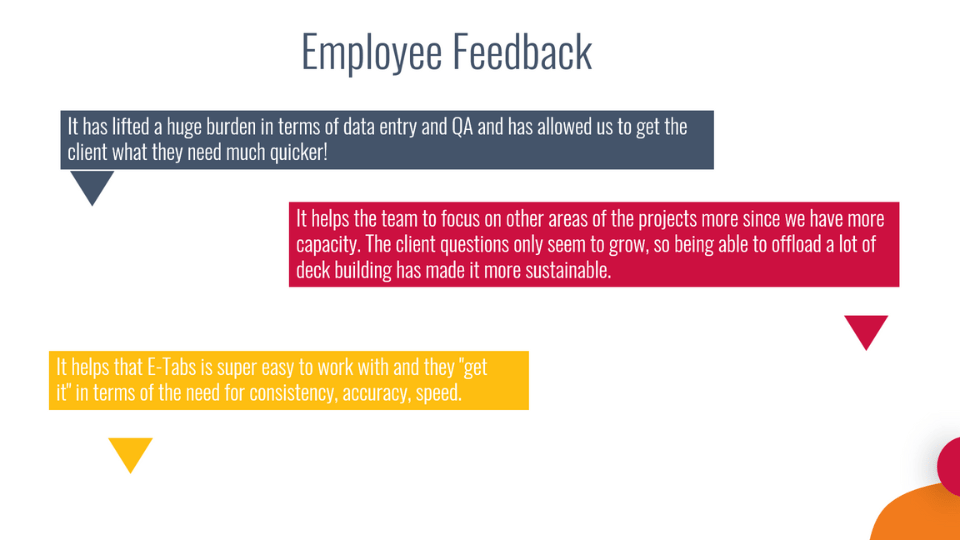
Impact on Employee Satisfaction
Partnering with E-Tabs has helped Illuminas’ reporting team accelerate project timelines and has offloaded the burden of data entry, QA, and deck building. Inserting E-Tabs Enterprise and the E-Tabs Reporting Bureau Service into the reporting process increased employee satisfaction and provided quicker quality results for Illuminas’ clients.
Features of E-Tabs Enterprise
Automate even the most detailed of PowerPoint, Word, Excel, Google Slides, Sheets or PDF reports quickly and with 100% accuracy. Enterprise can automate any ‘repetitive’ type project – whether a one-time multi-market or multi-category study, continuous tracker, KPI scorecard, concept-test or ad-test, with even the most demanding of requirements.
Click here to learn more about E-Tabs Enterprise.
